Almost every business owner who runs ads has received a report like this at least once: “Cost per lead is down 30%, click-through rate is up, reach hit a record high.” And then, at the end of the month, revenue hasn’t moved, the sales team complains about “junk” leads, and the ads have eaten more than they brought in.
The problem is almost never that “ads don’t work.” The problem is that the company only sees the beginning of the customer journey — the click and the lead — and not the end: the payment, the repeat purchase, the refund. End-to-end analytics closes that gap. It connects every dollar of ad spend to real money in the bank.
In this article we’ll explain what end-to-end analytics is in plain terms, why businesses without it almost always overpay for advertising, and how to roll it out step by step — even without a large IT department.
What end-to-end analytics means in plain terms
End-to-end analytics is a system that tracks each customer’s path from the first ad interaction to the payment, and shows how much money each channel, campaign and even individual ad actually generated.
Standard web analytics (Google Analytics, for example) answers the question “how many people visited the site and how many submitted a form.” End-to-end analytics answers a different question: “how much did we earn from every dollar we put into advertising?”
The difference sounds small, but that is exactly where most of the budget leaks. A lead is not money yet. Between the lead and the payment there is a sales team, lead quality, average order value and refunds — and these numbers differ dramatically from channel to channel.
Why a cheap lead doesn’t mean a cheap customer
Let’s look at an illustrative example. A company advertises in four channels and compares them by cost per lead (CPL). Judged by CPL alone, the winner is obvious: Instagram ads, at just $4 per lead.
But once the CRM is connected and the lead-to-sale conversion rate becomes visible, the picture flips.
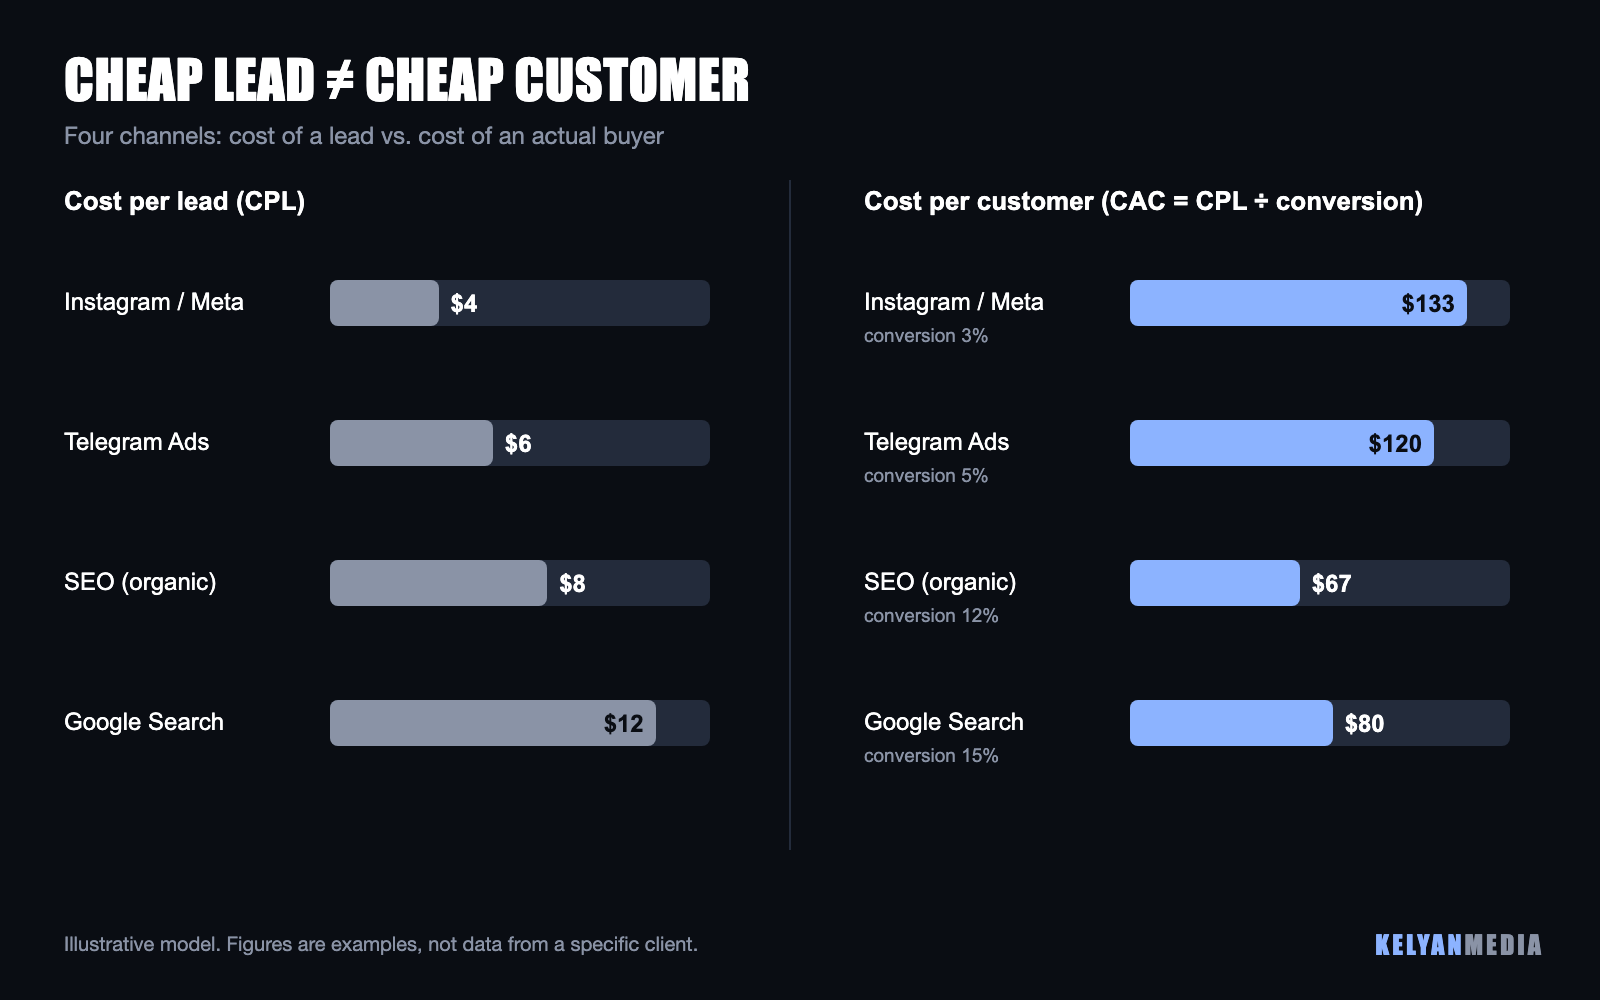
The math is simple: customer acquisition cost (CAC) equals cost per lead divided by the lead-to-sale conversion rate.
| Channel | CPL | Lead → sale conversion | CAC |
|---|---|---|---|
| Instagram / Meta | $4 | 3% | $133 |
| Telegram Ads | $6 | 5% | $120 |
| SEO (organic) | $8 | 12% | $67 |
| Google Search | $12 | 15% | $80 |
Google Search ads look like the “most expensive” channel per lead, yet they bring in customers at almost half the cost of Instagram. Someone actively searching for a service is already ready to buy. Someone who tapped a bright banner in their feed is often just curious.
Without end-to-end analytics, a marketer optimizing for CPL will move budget from the profitable channel to the unprofitable one — and report “improved efficiency.” It is the most common and the most expensive mistake in advertising.
How end-to-end analytics works
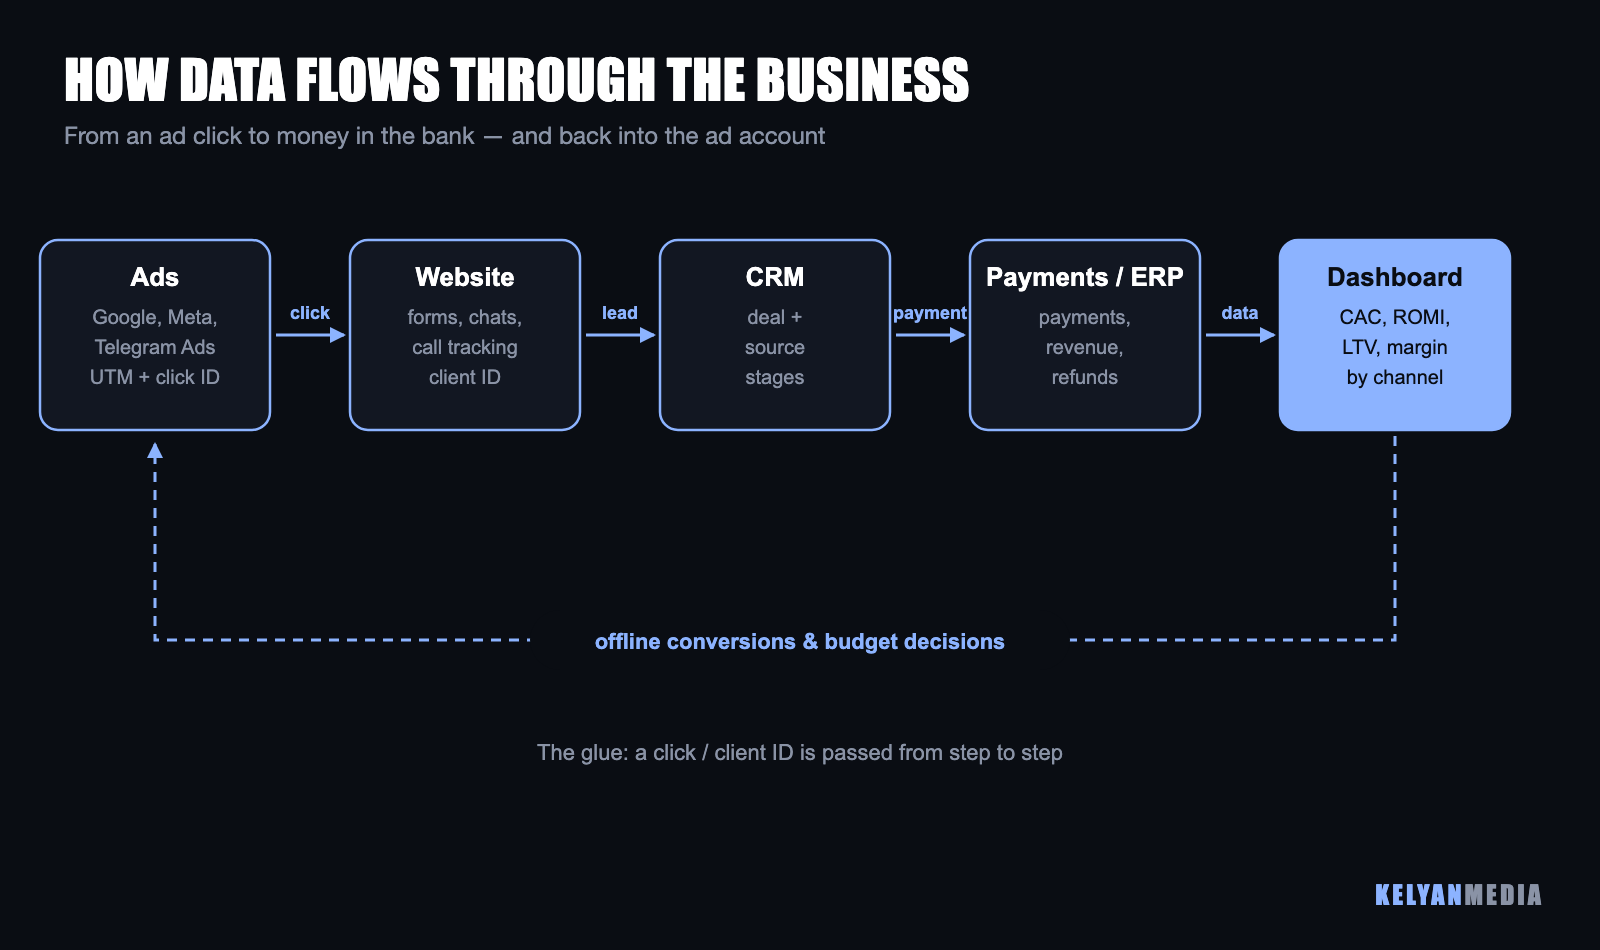
Technically, the system has five links. The key requirement is that a shared customer identifier is passed between them, so data from different systems can be stitched into one chain.
1. Ad platforms
Every ad link is tagged with UTM parameters (source, campaign, ad, keyword). On top of that, ad platforms append their own click IDs: gclid for Google, fbclid for Meta. That ID is what later lets you send sales data back to the ad account.
2. Website or landing page
A script on the site stores UTM tags and click IDs on the first visit and attaches them to every enquiry: forms, chat, phone calls, messenger clicks. Calls are tracked with call tracking — dynamic phone numbers that change depending on the traffic source. One important detail: store the tags in a cookie or localStorage, not just in the URL, or they’ll be lost when a visitor converts on a page other than the landing page.
3. CRM
The lead lands in the CRM together with its source. Sales reps then move the deal through the pipeline: “qualified,” “meeting,” “invoice sent,” “paid,” “lost.” This is the critical link: if reps don’t update stages, or create deals manually without a source, the whole system stops working.
4. Payments, accounting or ERP
The payment, its amount, refunds and repeat purchases are pulled from the accounting system. For an online store that means integrating the payment gateway; for B2B, an export from accounting.
5. Dashboard
All the data comes together in a single view (Looker Studio, Power BI or the CRM’s built-in reports). This is where you see what matters: CAC, ROMI, LTV and margin by channel, campaign and even individual ad.
The feedback loop: offline conversions
The most valuable part of the system is not the report — it’s the data flowing back. When a CRM deal is marked “paid,” the deal, its click ID and its value are sent back to Google Ads and Meta Ads as an offline conversion.
From then on, the platforms’ algorithms optimize delivery not for people who submit forms, but for people who pay. In practice this step has the most visible impact: customer acquisition cost goes down and the share of empty enquiries drops, because automated bidding stops chasing cheap clicks.
Which metrics to track
End-to-end analytics isn’t about pretty charts. It’s about a handful of numbers that drive budget decisions.
| Metric | Formula | What it shows |
|---|---|---|
| CPL | Spend ÷ number of leads | Cost of one enquiry |
| CR | Sales ÷ leads | Traffic quality and sales team performance |
| CAC | Spend ÷ new customers | Cost of acquiring one buyer |
| ROMI | (Gross profit − spend) ÷ spend × 100% | Whether advertising pays off |
| LTV | Average profit per customer over their lifetime | How much you can afford to spend on acquisition |
A rule worth pinning above every marketer’s desk: a channel deserves budget as long as CAC is below LTV — ideally below a third of it. Everything else is optimization detail.
A 4–6 week rollout plan
End-to-end analytics doesn’t require expensive enterprise software. For most small and mid-sized businesses, “UTM + CRM + a free dashboard” is enough.
- Audit (week 1). Review active channels, how links are tagged, where leads end up, whether there is a CRM and how the sales team uses it.
- Consistent tagging (weeks 1–2). Define UTM rules for every channel and enable auto-tagging in the ad platforms.
- On-site data capture (weeks 2–3). Store tags and click IDs, pass them into every form, connect call tracking and messenger click tracking.
- CRM integration (weeks 3–4). The source is written to each deal automatically; mandatory stages and loss reasons are set up.
- Connecting payments (weeks 4–5). Pull payment amounts and status from your payment system, accounting or ERP.
- Dashboard and offline conversions (weeks 5–6). Build the CAC and ROMI report and start sending payments back to Google Ads and Meta.
A typical mistake is to start with the dashboard. Without clean CRM data, even the most beautiful report will show the wrong picture. Data discipline first, visualization second.
Common implementation mistakes
- Sales reps don’t use the CRM. If deals are closed in a messenger and the CRM still says “new,” the system won’t see a single sale. The fix is a clear process and management oversight, not just technology.
- Some channels aren’t tagged. Influencers, newsletters, QR codes on offline ads — all of it ends up as “direct” traffic and distorts the picture.
- Only the first or only the last touch is counted. A customer may discover you on Instagram and buy after a Google search. Look at least at two attribution models and compare them.
- Revenue is counted instead of profit. A high-revenue channel may be selling low-margin products. ROMI is more honest when calculated from gross profit.
Who needs end-to-end analytics first
The system pays off fastest where the sales cycle is longer than a day and a lead isn’t the same as a purchase: real estate, healthcare, education, B2B services, high-ticket products, car dealerships, construction. If your monthly ad budget exceeds $1,000 and you run two or more channels, you are almost certainly allocating money blind without end-to-end analytics.
The KelyanMedia team sets up end-to-end analytics together with PPC campaigns: from tagging and CRM integration to the dashboard and offline conversions. To get an estimate for your business, fill out our PPC brief — we’ll review your current campaigns and show you where the budget is leaking.
FAQ
How much does it cost to implement end-to-end analytics?
It depends on the number of channels and whether you already have a CRM. Small businesses can often rely on free tools: UTM tags, Google Analytics, a CRM with a basic integration and Looker Studio. The main cost is specialist time for setup and integration, not software licenses.
Can we do it without a CRM?
You can get a partial picture with spreadsheets and manual sales entry, but that only works at low lead volumes. Once you get more than 50–100 leads a month, data starts slipping through the cracks without a CRM.
When will we see the first results?
Accurate data starts accumulating right after launch. For confident conclusions about channels you usually need one full sales cycle — from two weeks to two or three months depending on the industry.
Does it work for sales through Instagram and Telegram?
Yes. Messenger clicks are tagged with dedicated links or bots that capture the source and pass it to the CRM. The key is that reps chat with customers through a channel connected to the CRM, not from their personal accounts.